2QFY2017 Result Update | HFC
October 28, 2016
Dewan Housing Finance
ACCMULATE
CMP
`325
Performance Highlights
Target Price
`350
Investment Period
12 months
Particulars (` cr)
2QFY17 1QFY17
% chg (qoq) 2QFY16
% chg (yoy)
NII
492
457
7.7
407
20.9
Stock Info
Pre-prov. profit
396
348
13.8
323
22.7
Sector
HFC
PAT
232
201
15.2
181
27.9
Source: Company, Angel Research
Market Cap (` cr)
10,162
Dewan Housing Finance Corporation Limited (DHFL) reported 28.5% growth in
Beta
1.7
PAT at `231.5cr for the quarter, better than our expectations. Strong growth in
52 Week High / Low
337/141
loans, decline in cost of funds and resultant NIM improvement, together with cost
rationalization were the key factors that have supported the earnings growth.
Avg. Daily Volume
1,690,705
Loan growth remained strong: DHFL reported a 19.7% yoy growth in AUM to
Face Value (`)
10
`75,223cr. In absolute terms, the AUM grew by `3,211cr qoq. While sanctions
BSE Sensex
27,196
remained moderate, up by only 10% yoy, disbursements growth accelerated to
32% compared to 26% in 1QFY17. During the quarter, the company securitized
Nifty
8,615
loans worth `2,223 cr compared to `1,152cr in 1QFY17 and securitized portfolio
Reuters Code
DWNH.BO
accounted for 13% of the AUM.
DHFL continued to aggressively expand Project loan book: Loans to individuals
Bloomberg Code
DEWH.IN
reported a moderate growth of 12% yoy (70% of the AUM). However, DHFL
continued to aggressively expand its project loan book, primarily the loans to
projects, which went up by 129% yoy and accounted for 11.5% of the AUM
Shareholding Pattern (%)
compared to 9.8% qoq.
Promoters
37.4
Asset quality remained stable: Though in 1QFY17, we saw a marginal increase in
GNPAs, DHFL has been able to contain its asset quality during the quarter and
MF / Banks / Indian Fls
3.9
GNPAs stood at 0.96% vs 0.98% qoq. Despite aggressive growth in the non retail
FII / NRIs / OCBs
29.5
loan book in the recent quarters, DHFL has been able to maintain strong asset
quality and we don’t expect any change in trend in the near term.
Indian Public / Others
29.2
NIM expanded backed by low cost of funds: During 2QFY17, DHFL successfully
raised `14,000cr via NCDs at a very competitive rate and hence, it has been able
to reduce its cost of funds by 23 bps qoq. This has helped in improving its NIM by
Abs. (%)
3m
1yr
3yr
14 bps qoq to 3.05%. While in the near term the margins will remain stable, we
Sensex
(0.4)
2.4
35.0
believe the company could pass on some benefits of lower cost to gain market
share and thereby further try to accelerate its loan book.
DHFL
46.2
39.3
347.9
Outlook and valuation: DHFL’s 1HFY17 performance has been in line with
expectations on all counts. Going ahead, we expect it to post a healthy AUM
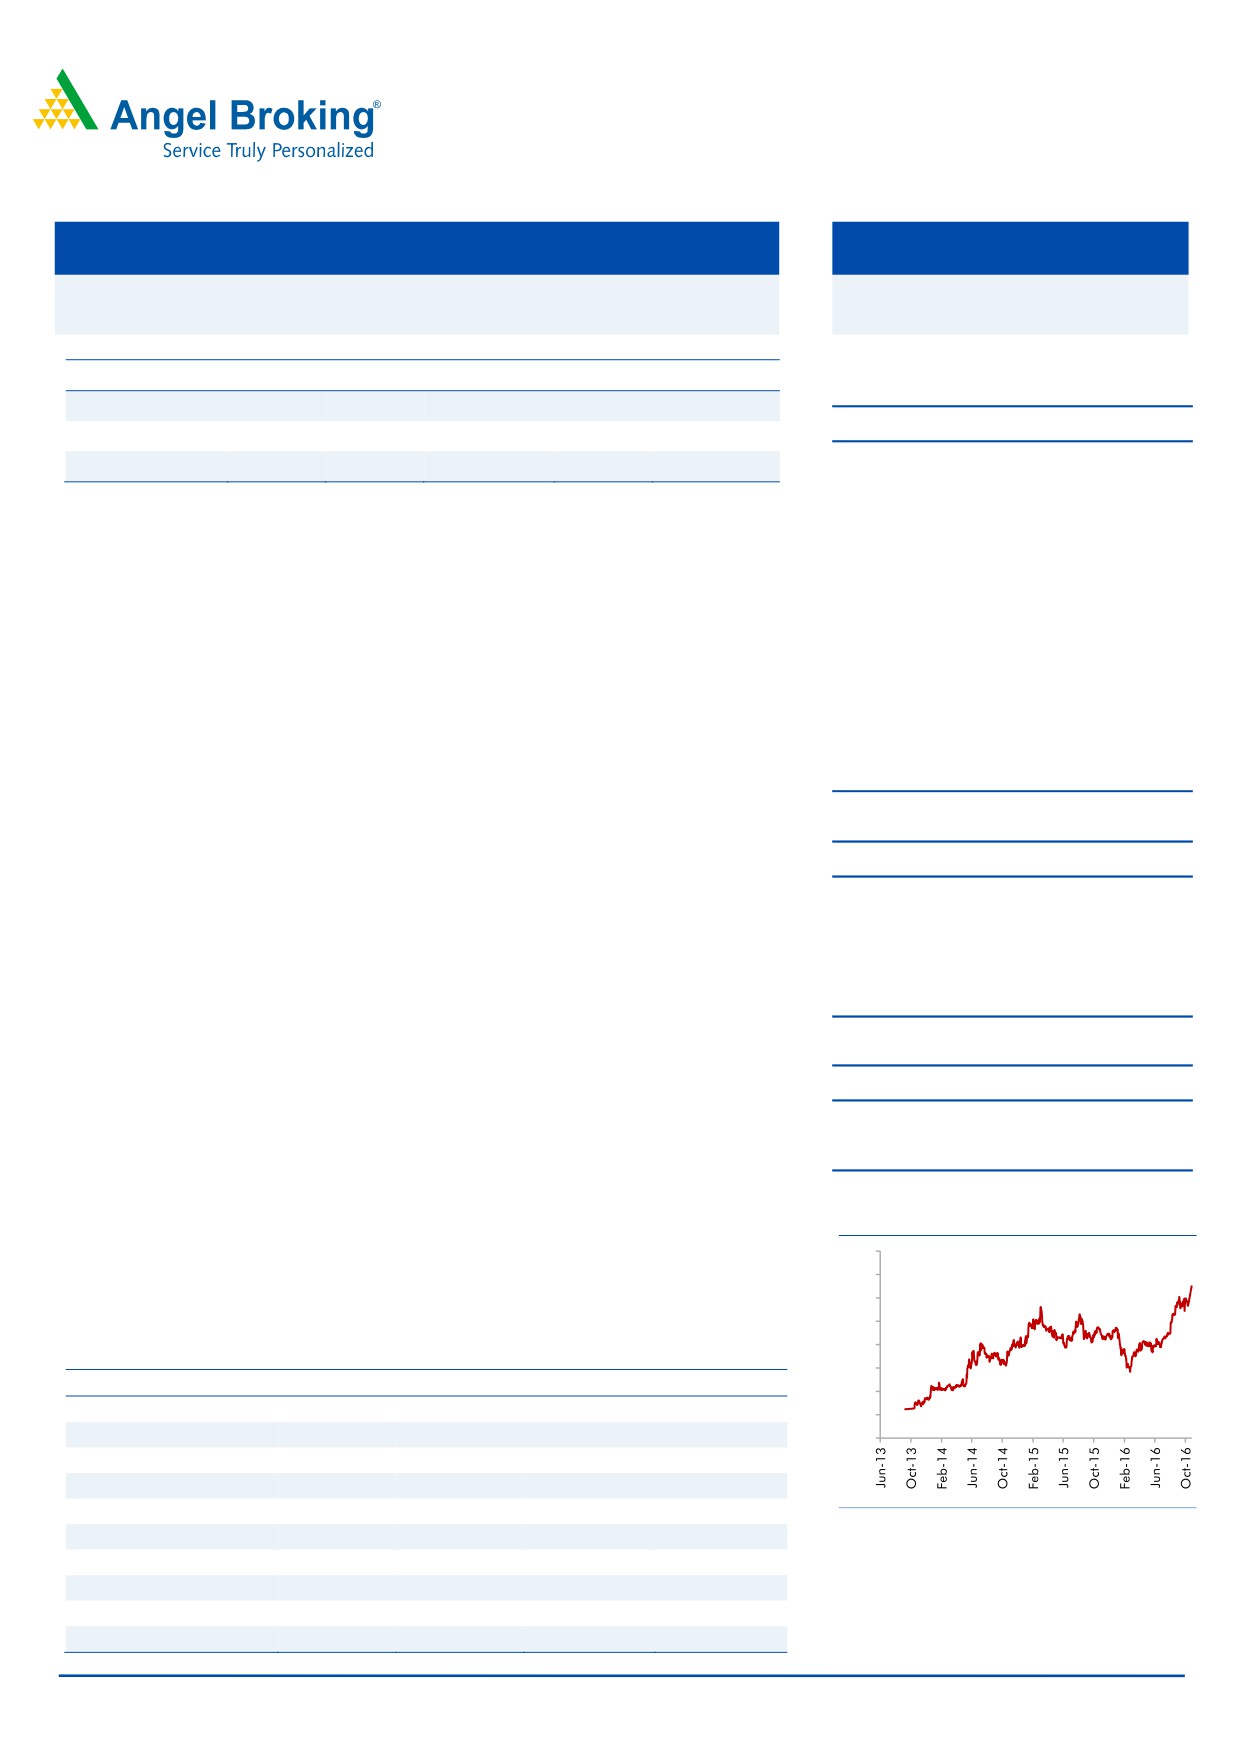
3-Year Daily Price Chart
CAGR of 21% over FY2015-18E, which is likely to translate in earnings CAGR of
23%, over the same period. The stock price has seen sharp run-up in the last two
400
quarters and despite of that is trading at a discount to other HFCs.
350
At the current level, the stock is valued at 1.5x FY2018E ABV. We have revised our
300
target price to `350 and maintain ACCMULATE on the stock.
250
200
Key financials (standalone)
150
Y/E March (` cr)
FY2015
FY2016
FY2017E
FY2018E
100
NII
1,256
1,664
2,050
2,500
50
% chg
41.5
32.5
23.2
21.9
-
Net profit
620
729
879
1,111
% chg
17.8
17.6
20.6
26.3
NIM (%)
2.8
2.9
2.9
2.9
Source: Company, Angel Research
EPS (`)
21.3
24.9
28.1
35.5
P/E (x)
15.3
13.1
11.6
9.2
P/ABV (x)
2.3
2.0
1.7
1.5
Siddharth Purohit
RoA (%)
1.3
1.2
1.2
1.2
022 - 3935 7800 Ext: 6872
RoE (%)
15.1
15.0
15.6
16.5
Source: Company, Angel Research; Note: CMP as of October 27, 2016
Please refer to important disclosures at the end of this report
1
Dewan Housing Finance | 2QFY2017 Result Update
Exhibit 1: 2QFY2017 performance (standalone)
Particulars (` cr)
2QFY17
1QFY17
% chg (qoq)
2QFY16
% chg (yoy)
1HFY17
1HFY16
% chg
Interest earned
2,123
1,932
9.9
1,764
20.4
4,055
3397
19.4
Interest expenses
1,631
1,475
10.6
1,357
20.2
3,106
2591
19.9
Net interest income
492
457
7.7
407
20.9
949
806
17.8
Non Interest Income
44
27
63.0
48
(8.3)
71
68
4.3
Operating income
536
484
10.7
455
17.8
1020
874
16.7
Operating expenses
133
130
2.3
125
6.4
263
245
7.4
Depreciation
7
6
13.5
7
(2.7)
13
12.7
0.9
Pre-prov. profit
396
348
13.8
323
22.7
744
616
20.8
Provisions & cont.
45
45
-
45
-
90
77
16.9
PBT
351
303
15.9
278
26.3
654
539
21.3
Prov. for taxes
120
102
17.3
97
23.3
222
185
19.8
PAT
232
201
15.2
181
27.9
433
354
22.1
EPS (`)
7.4
6.9
7.4
6.2
19.2
13.8
12.1
13.8
Effective tax rate (%)
34.1
33.7
34.9
33.9
34.30
Source: Company, Angel Research
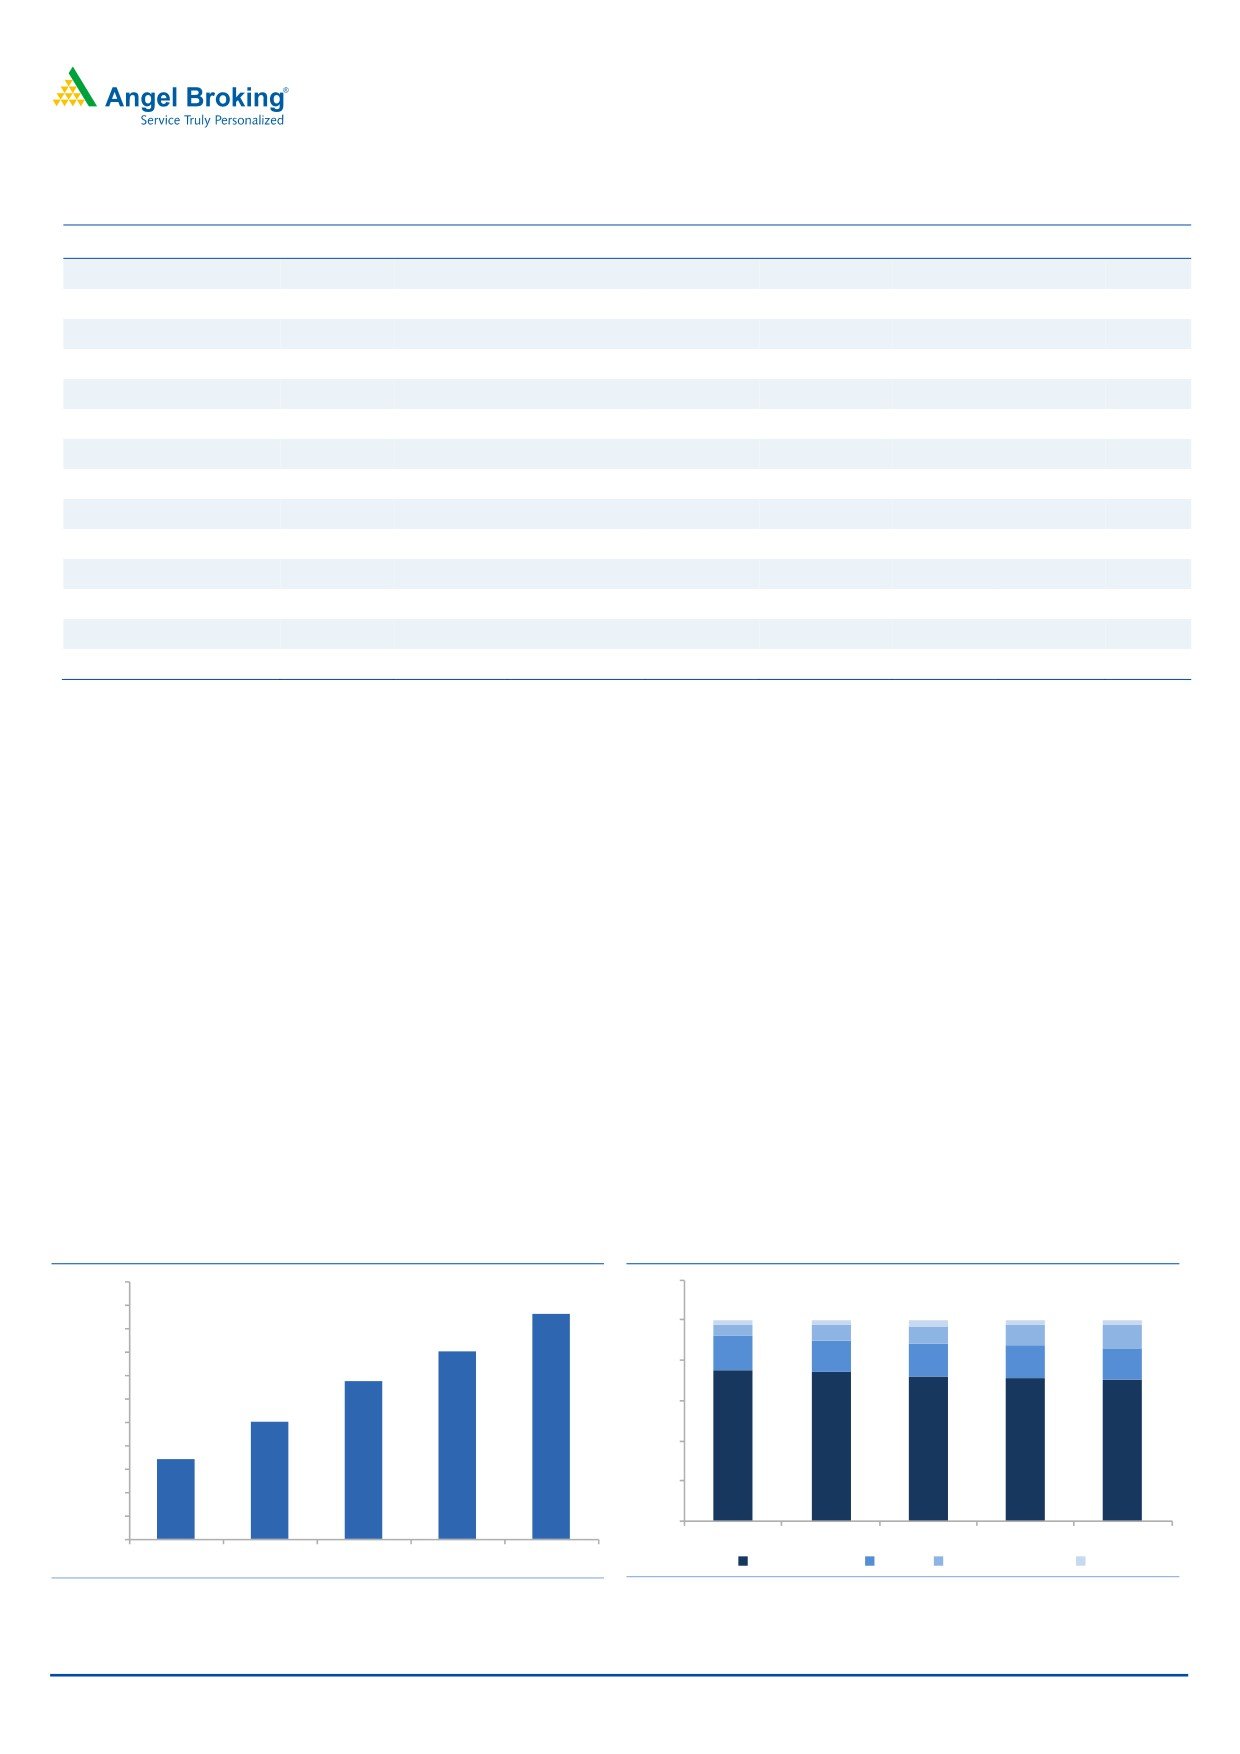
Loan growth remained strong during the quarter also: DHFL reported a 19.7% yoy
growth in AUM to `75,223cr. In absolute terms, the AUM grew by 4.5% qoq to
`3,211cr. While sanctions remained moderate by only 10% yoy, disbursements
growth accelerated to 32% compared to 26% in Q1FY17. During the quarter, the
company securitized loans worth `2,223cr compared to `1,152cr in Q1FY17 as
well as securitized portfolio accounted for 13% of the AUM. Lower cost of funds
and well capitalized balance sheet should help the company in accelerating its
loan book in the next couple of quarters.
DHFL continued to aggressively expand Project loan book: Loans to individuals
reported a moderate growth of 12% yoy (70% of the AUM). However, DHFL
continued to aggressively expand its project loan book, primarily the loans to
projects, which went up by 129% yoy and accounted for 11.5% of the AUM
compared to 9.8% qoq. Though growth in the project segments has been very
aggressive in the last few quarters, DHFL’s funding at entire project level rather
than working capital funding makes it much safer compared to what it is perceived
to be.
Exhibit 2: AUM growth remained strong
Exhibit 3: Loan Mix
120%
78,000
75,223
76,000
2%
2%
3%
100%
3%
3%
74,000
6%
72,012
8%
9%
10%
12%
72,000
17%
80%
16%
16%
69,524
16%
16%
70,000
68,000
60%
65,962
66,000
62,837
40%
64,000
75%
74%
72%
72%
70%
62,000
20%
60,000
58,000
0%
56,000
Q2FY16
Q3FY16
Q4FY16
Q1FY17
Q2FY17
Q2FY16
Q3FY16
Q4FY16
Q1FY17
Q2FY17
Home Loans
LAP
Project Finance
Others
Source: Company, Angel Research
Source: Company, Angel Research
October 28, 2016
2
Dewan Housing Finance | 2QFY2017 Result Update
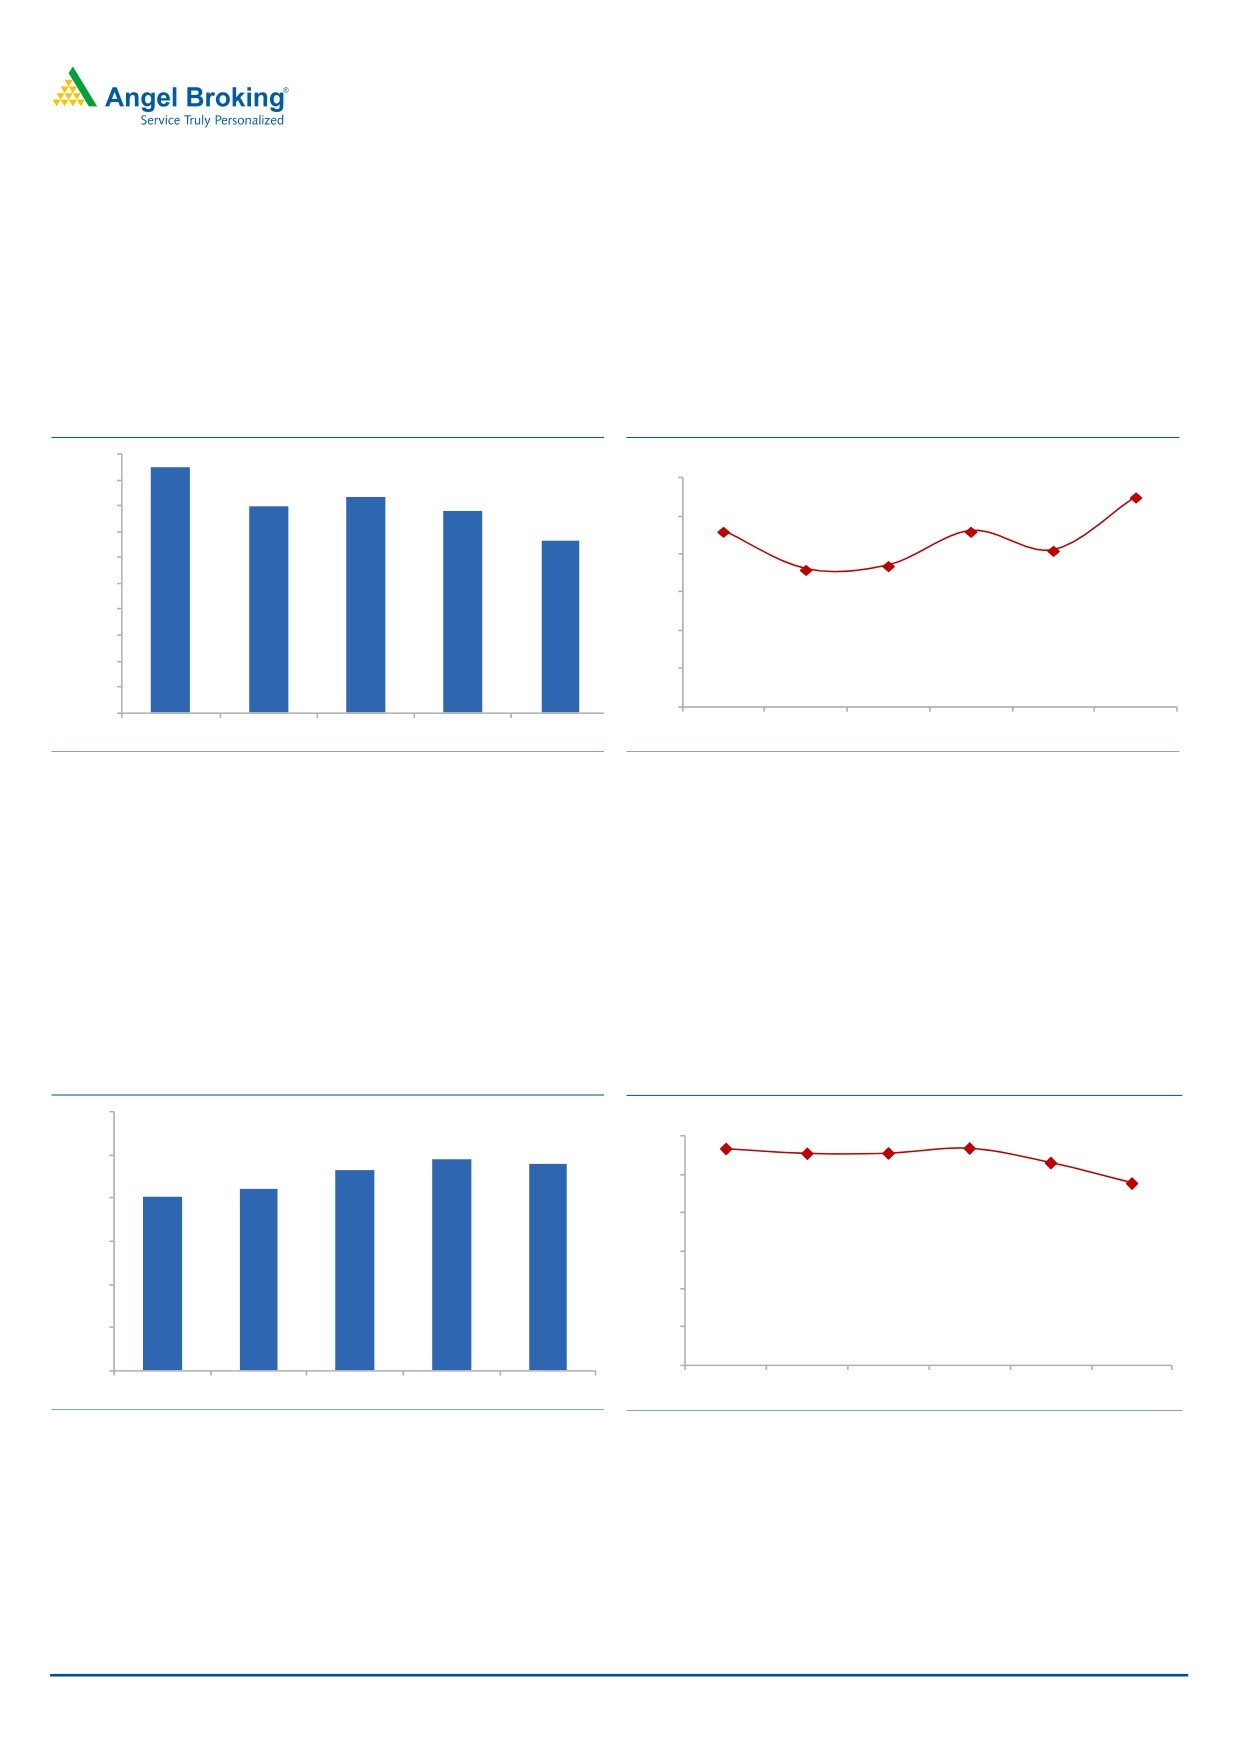
NIM expanded backed by low cost of funds: During Q2FY17, DHFL successfully
raised `14,000cr via NCDs at a very competitive rate and hence, it has been able
to reduce its cost of funds by 23bps qoq. This has helped in improving its NIM by
14 bps qoq to 3.05%. While in the near term the margins will remain stable, we
believe the company could pass on some benefits of lower cost to gain market
share and thereby further try to accelerate its loan book.
Exhibit 4: Reduction in cost of funds
Exhibit 5: Sharp rise NIM due to low cost of funds
10.00%
9.90%
(%)
3.1
3.05
9.80%
9.67%
9.60%
9.56%
9.60%
3.0
2.96
3.0
9.33%
2.91
9.40%
2.86
2.87
9.20%
2.9
9.00%
2.8
8.80%
8.60%
2.7
8.40%
2.6
8.20%
2.5
8.00%
Q1FY16
Q2FY16
Q3FY16
Q4FY16
Q1FY17
Q2FY17
Q2FY16
Q3FY16
Q4FY16
Q1FY17
Q2FY17
Source: Company, Angel Research
Source: Company, Angel Research
Asset quality stable for yet another quarter: DHFL has maintained stable asset
quality over the last few quarters. During Q1FY16, the company witnessed some
pressure on asset quality when the GNPAs went up to 0.98% from 0.93% in
Q4FY16. However, the current quarter has again been stable as far as asset
quality is concerned. Despite strong growth in the recent quarters and lending to
the LMI segment, which is perceived to be a risky segment, the company has been
able to maintain stable asset quality and hence, we don’t expect any deterioration
in the asset quality in the near term.
Exhibit 6: Asset quality remained stable
Exhibit 7: Cost / Income is trending down
1.20%
(%)
26.8
26.8
26.3
26.3
0.98%
28.0
25.3
0.96%
1.00%
0.93%
23.1
0.84%
24.0
0.81%
0.80%
20.0
0.60%
16.0
0.40%
12.0
0.20%
8.0
4.0
0.00%
Q1FY16
Q2FY16
Q3FY16
Q4FY16
Q1FY17
Q2FY17
Q2FY16
Q3FY16
Q4FY16
Q1FY17
Q2FY17
Source: Company, Angel Research
Source: Company, Angel Research
October 28, 2016
3
Dewan Housing Finance | 2QFY2017 Result Update
Outlook and valuation
The performance of DHFL in the first two quarters’ has been in line with the
expectations on all counts. Going ahead, we expect the company to post a healthy
AUM CAGR of 21% over FY2015-18E, which is likely to translate in earnings
CAGR of 23%, over the same period. The stock price has seen sharp run-up in the
last two quarters and despite of that is trading at a discount to other HFCs. At the
current level, the stock is valued at 1.5x FY2018E ABV. We have revised our target
price to `350 and maintain an ACCMULATE on the stock.
Company Background
Dewan Housing was established in 1984 by Late Shri Rajesh Kumar Wadhawan.
DHFL is a dominant player in niche markets (tier II & III cities) with strong foothold
in the low and middle income (LMI) segment. After the acquisition and merger of
First Blue Home Finance, DHFL now caters also to the middle and upper middle
income groups. The company operates in the mortgage financing business where
the growth and asset quality have remained healthy over the past few years.
The company has emerged as a one-stop-shop for its customers’ financial needs,
extending beyond home loans. The company has a presence in the education
loans, life insurance, and mutual funds segments through Avanse Education Loans,
DHFL Pramerica Life Insurance and DHFL Pramerica Asset Managers Pvt Ltd,
respectively.
It is India’s third largest private sector HFC with an AUM of `75,223cr as on
30th October, 2016. The company has a well diversified loan book with housing
loans accounting for the largest share of 70%, followed by LAP (15.7%), project
loans (11.5%) and loans to SME (2.6%) (as of 30th October, 2016).
October 28, 2016
4
Dewan Housing Finance | 2QFY2017 Result Update
Income statement (standalone)
Y/E March (` cr)
FY2013 FY2014
FY2015
FY2016
FY2017E
FY2018E
NII
678
888
1,256
1,664
2,050
2,500
- YoY Growth (%)
70.0
30.9
41.5
32.5
23.2
21.9
Other Income
280
296
265
164
175
188
- YoY Growth (%)
11.7
5.8
(10.5)
(38.3)
7.1
7.4
Operating Income
958
1,184
1,522
1,828
2,225
2,688
- YoY Growth (%)
47.5
23.6
28.5
20.1
21.7
20.8
Operating Expenses
304
384
480
550
616
691
- YoY Growth (%)
22.3
26.2
25.2
14.5
12.0
12.1
Pre - Provision Profit
654
801
1,041
1,278
1,609
1,997
- YoY Growth (%)
63.1
22.4
30.1
22.7
25.9
24.1
Prov. & Cont.
45
66
99
175
274
311
- YoY Growth (%)
89.9
47.7
48.7
77.4
56.2
13.5
Profit Before Tax
609
734
943
1,102
1,335
1,686
- YoY Growth (%)
61.4
20.5
28.4
16.9
21.1
26.3
Prov. for Taxation
159
206
322
373
456
575
- as a % of PBT
26.1
28.1
34.1
33.8
34.1
34.1
PAT
459
527
620
729
879
1,111
- YoY Growth (%)
60.9
14.8
17.8
17.6
20.6
26.3
Balance sheet (standalone)
Y/E March (` cr)
FY2013 FY2014
FY2015
FY2016
FY2017E
FY2018E
Share Capital
128
128
146
292
313
313
Reserve & Surplus
3,109
3,447
4,490
4,725
5,934
6,849
Loan Funds
27,441
33,890
40,526
49,800
61,730
76,519
- Growth (%)
61.9
23.5
19.6
22.9
24.0
24.0
Other Liab. & Prov.
5,172
6,465
9,557
13,115
14,901
18,246
Total Liabilities
35,850
43,930
54,718
67,933
82,878
1,01,928
Investments
275
721
1,006
1,249
1,524
4,080
Advances
32,403
38,651
48,789
60,572
73,898
88,677
- Growth (%)
77.5
19.3
26.2
24.2
22.0
20.0
Fixed Assets
438
988
985
1,222
1,491
1,834
Other Assets
2,735
3,569
3,938
4,889
5,965
7,336
Total Assets
35,850
43,930
54,718
67,933
82,878
1,01,928
October 28, 2016
5
Dewan Housing Finance | 2QFY2017 Result Update
Ratio analysis (standalone)
Y/E March
FY2013
FY2014
FY2015
FY2016
FY2017E
FY2018E
Profitability ratios (%)
NIMs
2.6
2.4
2.8
2.9
2.9
2.9
Cost to Income Ratio
31.7
32.4
31.6
30.1
27.7
25.7
RoA
1.6
1.3
1.3
1.2
1.2
1.2
RoE
17.4
15.5
15.1
15.0
15.6
16.5
Asset Quality (%)
Gross NPAs
0.73
0.8
1.0
1.1
1.17
1.3
Net NPAs
0.48
0.5
0.7
0.8
0.82
0.8
Provision Coverage
34.2
33.5
28.7
31.5
33.1
38.6
Per Share Data (`)
EPS
17.9
20.5
21.3
24.9
28.1
35.5
ABVPS (75% cover.)
118.7
129.0
143.7
162.0
187.8
216.4
DPS
1.0
1.6
1.1
0.6
0.7
0.9
Valuation Ratios
PER (x)
18.2
15.8
15.3
13.1
11.6
9.2
P/ABVPS (x)
2.7
2.5
2.3
2.0
1.7
1.5
Dividend Yield
0.3
0.5
0.3
0.2
0.2
0.3
DuPont Analysis
NII
2.4
2.2
2.5
2.7
2.7
2.7
(-) Prov. Exp.
0.2
0.2
0.2
0.3
0.4
0.3
Adj. NII
2.2
2.1
2.3
2.4
2.4
2.4
Treasury
0.0
0.0
0.0
0.0
0.0
0.0
Int. Sens. Inc.
2.2
2.1
2.4
2.4
2.4
2.4
Other Inc.
0.9
0.7
0.5
0.3
0.2
0.2
Op. Inc.
3.2
2.8
2.9
2.7
2.6
2.6
Opex
1.1
1.0
1.0
0.9
0.8
0.7
PBT
2.1
1.8
1.9
1.8
1.8
1.8
Taxes
0.6
0.5
0.7
0.6
0.6
0.6
RoA
1.6
1.3
1.3
1.2
1.2
1.2
Leverage
10.9
11.7
12.0
12.7
13.4
13.7
RoE
17.1
15.5
15.1
15.0
15.6
16.5
October 28, 2016
6
Dewan Housing Finance | 2QFY2017 Result Update
Research Team Tel: 022 - 39357800
DISCLAIMER
Angel Broking Private Limited (hereinafter referred to as “Angel”) is a registered Member of National Stock Exchange of India Limited,
Bombay Stock Exchange Limited and Metropolitan Stock Exchange Limited. It is also registered as a Depository Participant with CDSL
and Portfolio Manager with SEBI. It also has registration with AMFI as a Mutual Fund Distributor. Angel Broking Private Limited is a
registered entity with SEBI for Research Analyst in terms of SEBI (Research Analyst) Regulations, 2014 vide registration number
INH000000164. Angel or its associates has not been debarred/ suspended by SEBI or any other regulatory authority for accessing
/dealing in securities Market. Angel or its associates/analyst has not received any compensation / managed or co-managed public
offering of securities of the company covered by Analyst during the past twelve months.
This document is solely for the personal information of the recipient, and must not be singularly used as the basis of any investment
decision. Nothing in this document should be construed as investment or financial advice. Each recipient of this document should
make such investigations as they deem necessary to arrive at an independent evaluation of an investment in the securities of the
companies referred to in this document (including the merits and risks involved), and should consult their own advisors to determine
the merits and risks of such an investment.
Reports based on technical and derivative analysis center on studying charts of a stock's price movement, outstanding positions and
trading volume, as opposed to focusing on a company's fundamentals and, as such, may not match with a report on a company's
fundamentals. Investors are advised to refer the Fundamental and Technical Research Reports available on our website to evaluate the
contrary view, if any.
The information in this document has been printed on the basis of publicly available information, internal data and other reliable
sources believed to be true, but we do not represent that it is accurate or complete and it should not be relied on as such, as this
document is for general guidance only. Angel Broking Pvt. Limited or any of its affiliates/ group companies shall not be in any way
responsible for any loss or damage that may arise to any person from any inadvertent error in the information contained in this report.
Angel Broking Pvt. Limited has not independently verified all the information contained within this document. Accordingly, we cannot
testify, nor make any representation or warranty, express or implied, to the accuracy, contents or data contained within this document.
While Angel Broking Pvt. Limited endeavors to update on a reasonable basis the information discussed in this material, there may be
regulatory, compliance, or other reasons that prevent us from doing so.
This document is being supplied to you solely for your information, and its contents, information or data may not be reproduced,
redistributed or passed on, directly or indirectly.
Neither Angel Broking Pvt. Limited, nor its directors, employees or affiliates shall be liable for any loss or damage that may arise from
or in connection with the use of this information.
Disclosure of Interest Statement
Dewan Housing Finance
1. Financial interest of research analyst or Angel or his Associate or his relative
No
2. Ownership of 1% or more of the stock by research analyst or Angel or associates or relatives
No
3. Served as an officer, director or employee of the company covered under Research
No
4. Broking relationship with company covered under Research
No
Ratings (Based on expected returns
Buy (> 15%)
Accumulate (5% to 15%)
Neutral (-5 to 5%)
over 12 months investment period):
Reduce (-5% to -15%)
Sell (< -15)
October 28, 2016
7